EcoTrack
A carbon-footprint tracker that turns everyday choices into CO₂e estimates, so making sustainable decisions doesn't require a research project.
- React
- JavaScript
- Python
- Flask
- HTML
- CSS
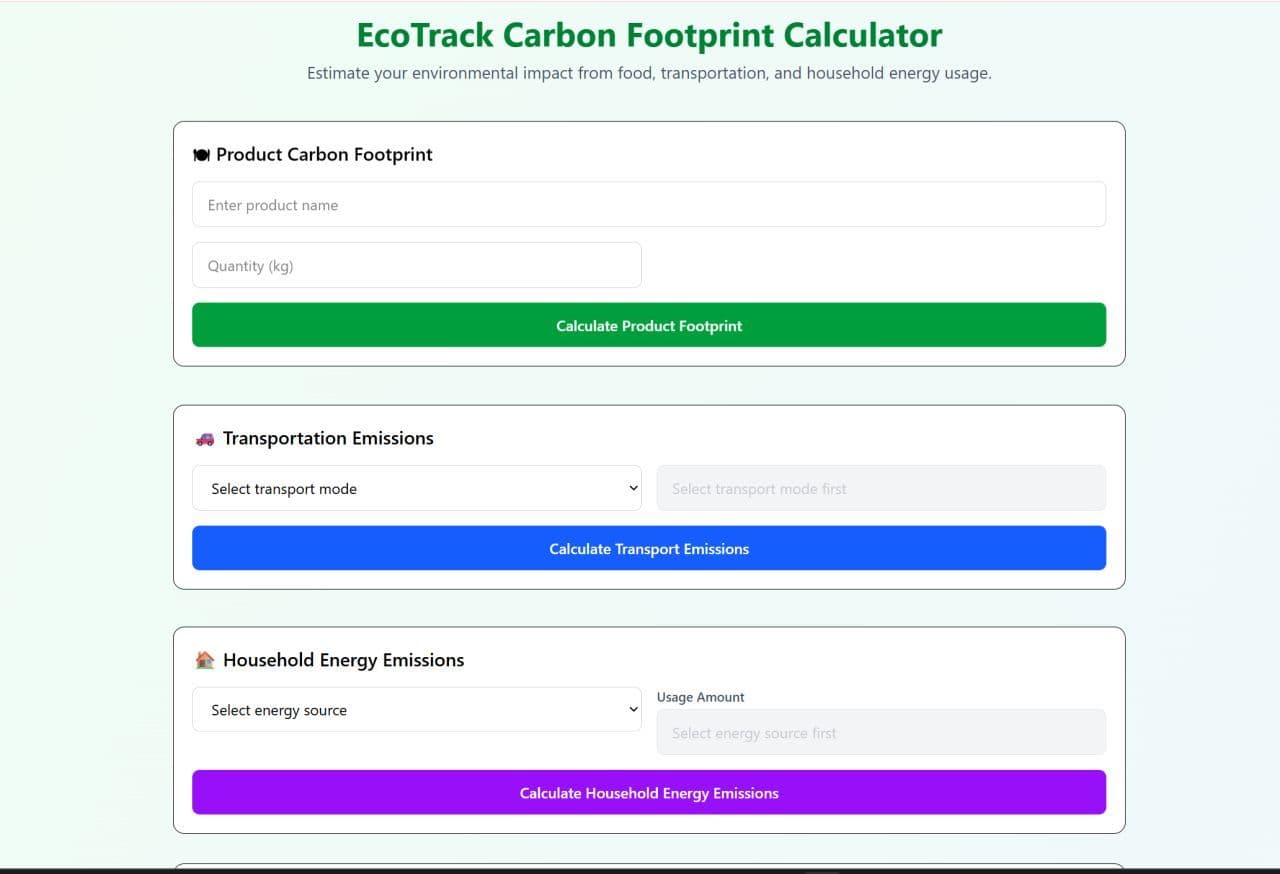
Built at Queen's University for APSC 103, EcoTrack started from a problem a lot of students share: wanting to make more sustainable choices, but not having a simple way to understand the environmental impact of everyday actions.
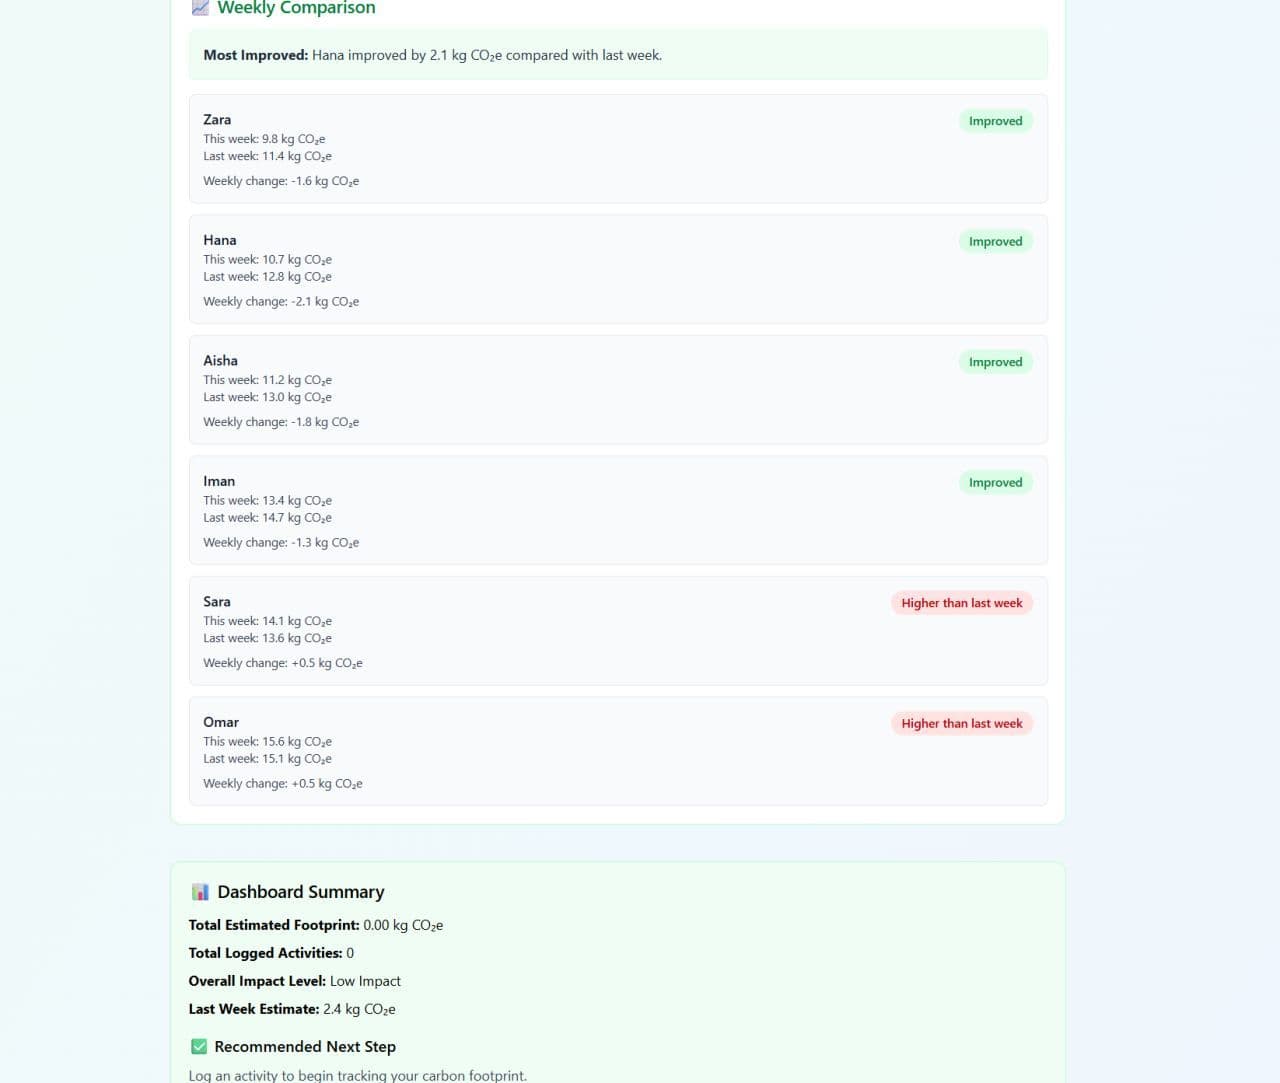
It was a team project — a group of five, with a project manager coordinating us — and I worked on the React front end and the API integration: the interface where you enter an activity, get an estimated CO₂e value, and watch your cumulative impact build through an interactive dashboard, plus lower-carbon recommendations to help you make more informed decisions.
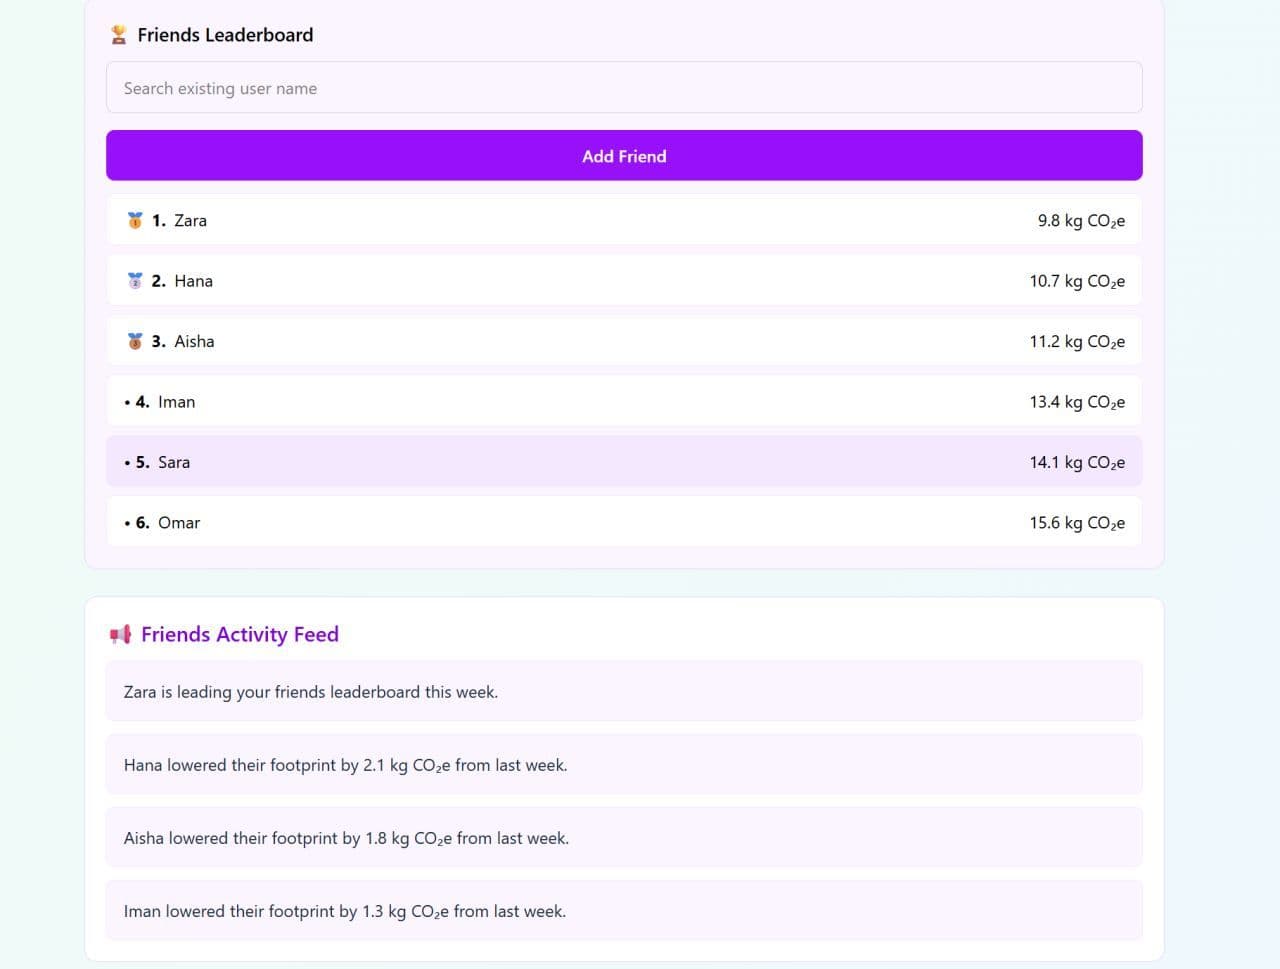
To make it stick, we added a social layer: a friends leaderboard, week-over-week comparisons, and an activity feed that surfaces who's cut their footprint the most. Turning a solo tracker into something a little competitive was meant to make sustainable habits easier to keep.
The prototype came together with a React front end talking to a Python and Flask backend that handled the emissions estimates. Getting the front end and the API to agree on how data flowed — my main piece — was where most of the real learning happened, and where an idea on paper became something that actually ran.